UK Flat Price Change Analysis
This project analyses changes in flat prices across different regions of the UK between July 2017 and July 2018. The analysis uses visualisations and statistical testing to determine whether the region of a property has a statistically significant association with the direction of its price change.
Methodology
Data Preprocessing: Data for July 2017 and July 2018 are extracted, and redundant rows are discarded.
Visualisation: Plots for each region are created, with bars showing price changes for each area. Red bars indicate price decreases, blue bars indicate no change, and green bars indicate price increases.
Statistical Testing: A Chi-squared test and a permutation test are used to test the independence of region and price change.
Findings
Visual analysis suggests a potential association between region and price change direction, with regions like London and the South East showing price decreases and regions like the West Midlands showing price increases.
Both the Chi-squared test and the permutation test yield very low p-values (0.000086 and 0.0002, respectively).
These results strongly suggest that the region of a property is significantly associated with whether its price increased or decreased between July 2017 and July 2018.
Conclusion
The analysis provides evidence to reject the null hypothesis of independence between region and price change direction. The findings indicate a statistically significant association between the region of a property in the UK and the direction of its price change between July 2017 and July 2018.
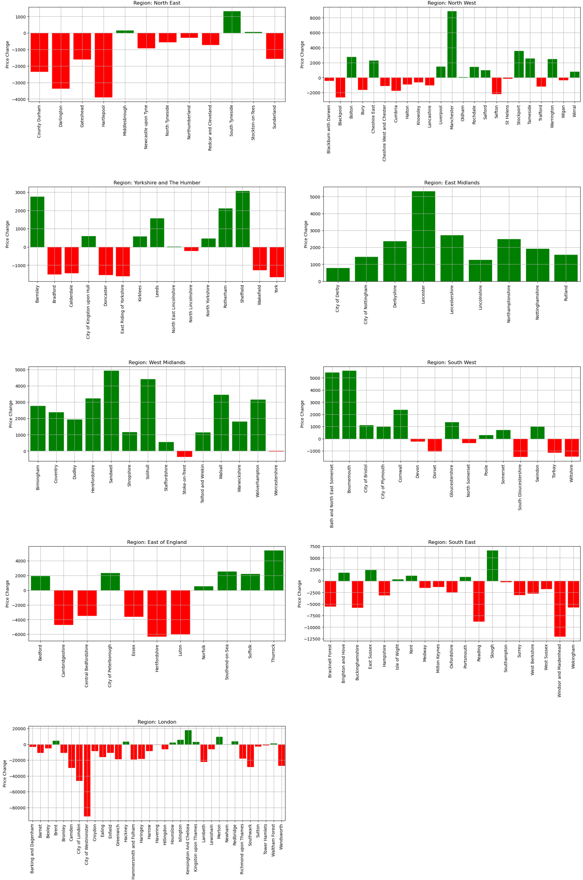
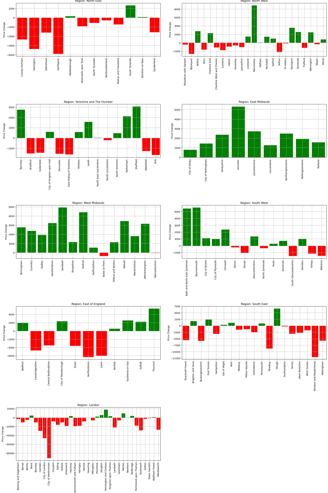
Image showing a bar plots for each of the 9 regions. Each bar represents an area within a region and shows the price change from July2017 - July2018
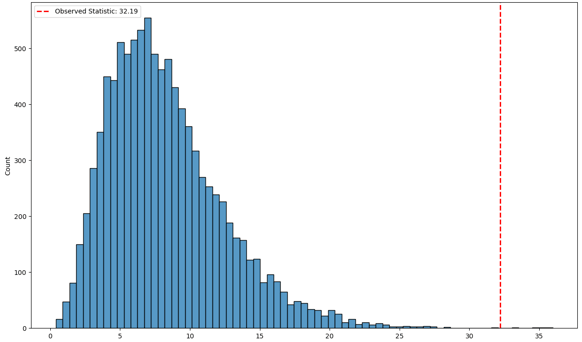
Image showing the distribution of g values obtained from the permutation tests. The red line indicates the observed g value from the data. This allows the p value to be determined as the proportion of values to the right of the line.