Stork Numbers & Population Analysis
This exersize explores the relationship between stork populations and human birth rates across various European countries. The analysis critically examines the often-cited correlation between these variables, using statistical modeling and the bootstrap technique to evaluate different predictors of birth rates and assess the validity of the "storks deliver babies" hypothesis. 2 models are created and compared.
Project Objectives:
Construct and compare two regression models to explain variability in birth rates:
Model 1: Predicting birth rates based solely on stork populations (as in the original paper).
Model 2: Predicting birth rates based on population size, GDP per capita, and population density.
Utilise the bootstrap technique to estimate confidence intervals for model performance metrics, specifically Root Mean Squared Error (RMSE).
Evaluate model fit, predictive accuracy, and residual characteristics through visual and statistical analysis.
Discuss the implications of the findings, emphasizing the distinction between correlation and causation in statistical analysis.
Key Findings:
Model 2, incorporating population size, GDP per capita, and population density as predictors, significantly outperforms Model 1 in explaining birth rate variability.
Model 2 exhibits a substantially higher R-squared value (0.77) and a lower RMSE (189.26) compared to Model 1 (R-squared = 0.38, RMSE = 312.03).
Bootstrap analysis reveals narrower confidence intervals for Model 2's RMSE, indicating greater predictive reliability.
Residual analysis suggests that while both models exhibit deviations from normality and some heteroscedasticity, these issues are less pronounced in Model 2.
Although Model 2 identifies a strong relationship between the chosen predictors and birth rates, the study reinforces the crucial distinction between correlation and causation. The findings highlight the need for cautious interpretation of statistical results and consideration of potential confounding factors.
This project serves as a demonstration of statistical modeling techniques and critical evaluation in data analysis, emphasizing the importance of considering alternative explanations and the limitations of correlational findings.
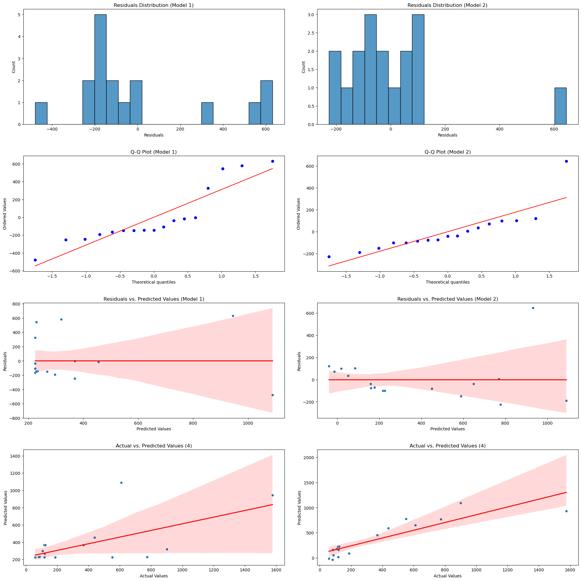
Image showing plots comparing both models. Q-Q plots, residual distribution, residual vs predictions and actual vs predictions are plotted. The lower variance in model 2 can be seen.
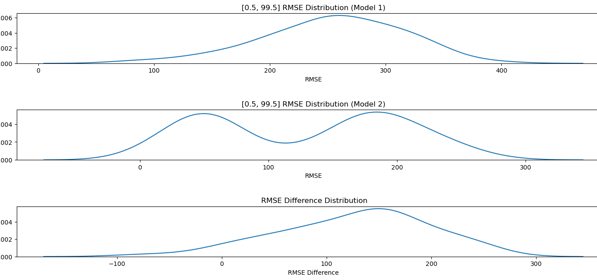
Image showing RMSE Distribution of both models. 2 distict peaks can be observed in model 2.